


We all do some sort of logging on our servers, may be log files, database, Application Insights, etc. But that won’t do us much good, if there are no active measures set against them. I am talking about automatic alerts, which will allow us to react quickly in case of performance issues or failures. That’s why we will setup alerts from Azure Log Service which will serve us as a basis for manual and automatic responses to errors and failures.
If you missed my previous posts on how to ship and parse logs to Azure log service, here is a list:
- Shipping logs to Azure Log Analytics,
- Parsing logs to Azure log service from on-prem virtual machine,
- Add VM performance counters to Azure Log Service
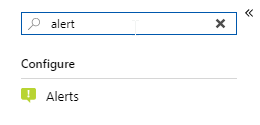
Alerts can be set from Azure portal inside a subscription, a resource type or a resource group. In the blade menu you can search for “Alerts” item and select it.
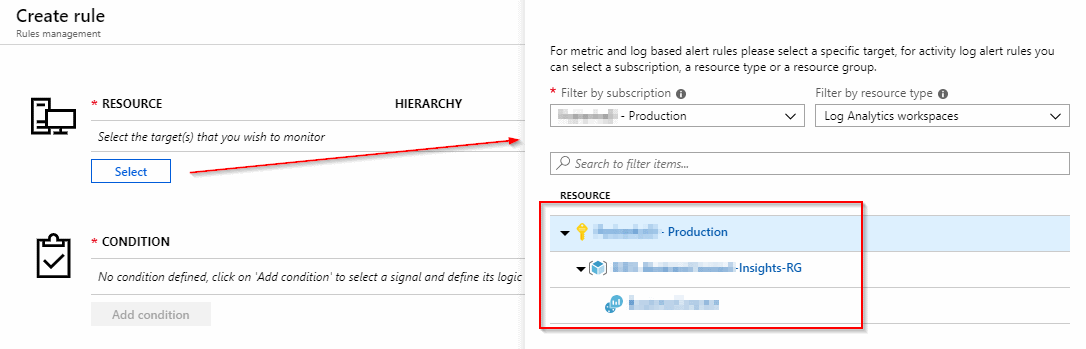
A create rule page is opened, where you can set your alert properties. In a nutshell, you will need to set Resource, Condition, Action group and Alert details to create an alert.
Select a resource
A resource is a target you wish to monitor. In our case we will select a Log Analytics workspace, where we store all of our text logs, performance counters from virtual machines, Application Insights logs and other. In other words, we have to specify the source of our log data, which is a basis for the alert condition. And this is a topic of the next step.
Condition
Now we select a condition and a signal we wish to monitor. As we open the “Configure signal logic” blade we get a lot of different signals. From custom logs, saved log queries, metrics and activity logs. In our resource we have 179 signal to choose from, so we can get really creative.
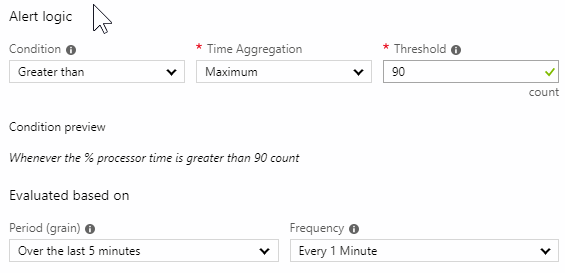
We would like to monitor the CPU usage and get an alert when CPU on a specific server will reach 90%. Query will be set for log window of 5 minutes, with 30 measurements and the frequency of 1 minute. This might not be ideal, but it’s a start. This particular server hosts an important web application and integrations and can reach 100% in peak times. This happens twice a day when a lot of employees are using it to complete the reports and sort out the documents. As a good practice, we would like to know that before the client calls us. Also, by monitoring performance counters and logs we get an important data to discuss optimizations and infrastructure upgrades.
Back to our signal. From the list we select % Processor Time and select a history over the last week. Below we select a computer dimension (server name) and check the graph of that server.
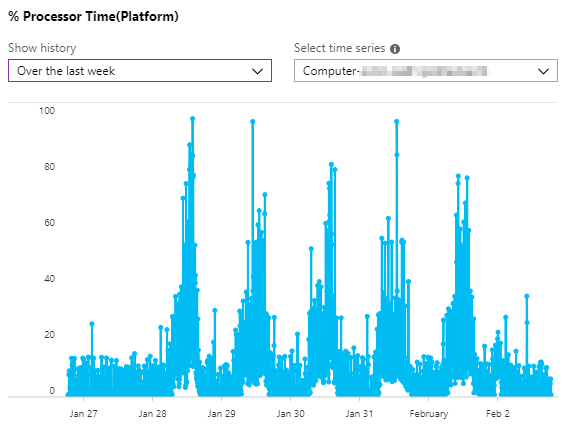
From the graph we can see that there are some instances in a day where the CPU went above 90%. And we need to get notified when that happens, because we know that can impact the responsiveness and performance of the application. OK let’s set the Alert logic next.
Action groups
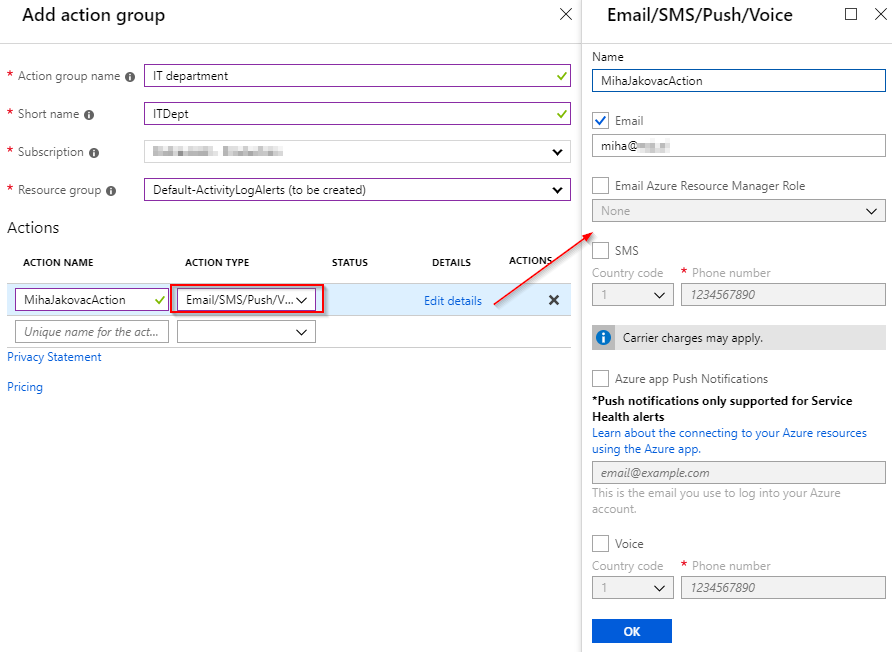
Currently we only use Email alerts, but they offer much more than that. We can trigger Azure functions, logic applications, webhooks, SMS, etc. Read more about that here: Create and manage action groups in the Azure portal. Check the screen below where I create a simple email Action group, which will be reused for other alerts as well.
Alert details
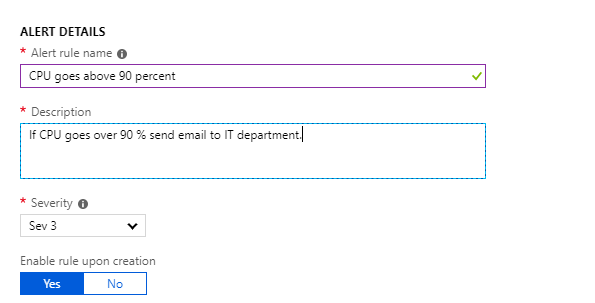
Finally in the last section you specify the alert details as name, description and severity level.
Conclusion
And that’s it! When you create a new alert, you need to monitor the logs closely for a few days and tweak the conditions accordingly. If the alert is not triggered when incidents happen, you’ll obviously need to change the condition or alert logic. Please do some analysis of your log data and adjust the period, frequency and time aggregation to improve the precision of the alerting.
If you need more details, please check the Microsoft documentation here and here.
You are welcome to leave a comment or ask a question below!
Ta-da!
Leave a Reply
You must belogged in to post a comment.