


In my last post I was writing about the implementation of shipping the log files to Azure Log Service. I suggest you read it first. If you already have custom logs implemented than read along.
We finished up with the log files successfully stored in the Azure log service without any parsing of a log. The whole log line from the file is stored in the RawData column and in order to query it you have to write a query that is not efficient.
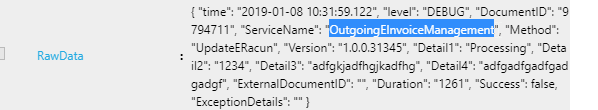
The logs are one-per-line, un-formatted JSON objects like this:
{ “time”: “2019-01-20 17:57:08.015”, “level”: “ERROR”, “DocumentID”: “3453535”, “ServiceName”: “OutgoingEInvoiceManagement”, “Method”: “GetIntegrationStatus”, “Version”: “1.0.0.31345”, “Detail1”: “Error importing a file to document system.”, “Detail2”: “”, “Detail3”: “”, “Detail4”: “”, “ExternalDocumentID”: “”, “Duration”: “1425”, “Success”: false, “ExceptionDetails”: “Exception….” }
{…}
Sure I could write the query with parse_json, to parse the logs on the fly, but we want to do better and parse the logs before they are stored in Azure log service. In this post I will show you how you can do that.
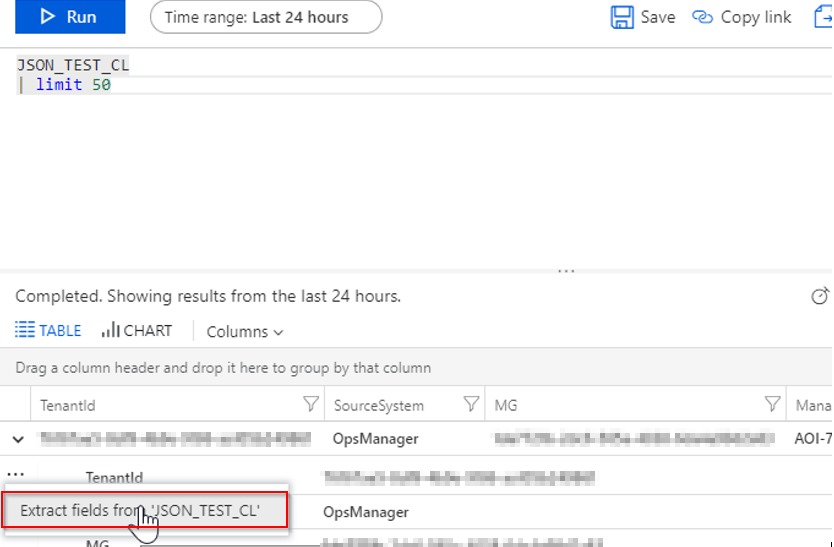
First, let’s open up the Analytics log and write a query that will grab a few rows, in our case 50. Once you do that, expand one log entry and click on the three dots button to show the popup menu “Extract fields from…“:
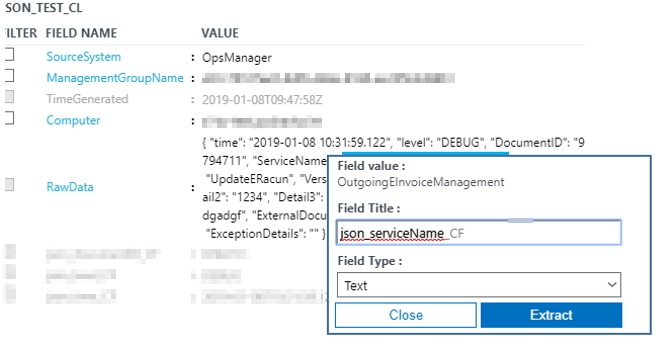
This will open up a form where you can train the Azure log service to read your log files. Under the column RawData select the content of the property you want to extract and store as a custom field. In the sample below I selected “OutgoingEInvoiceManagement” value of the “ServiceName” property in our JSON log.
Then set the name of the parameter and set its type. In our case I entered json_serviceName as a prefix and type as a text. You can also specify numeric, boolean, GUID or ISO 8601 datetime type. Then click on Extract button. I should mention here, that in order for this to succeed you need a 1000 or so log entries, otherwise the engine will not work. In other words, the sample log has to be big enough.
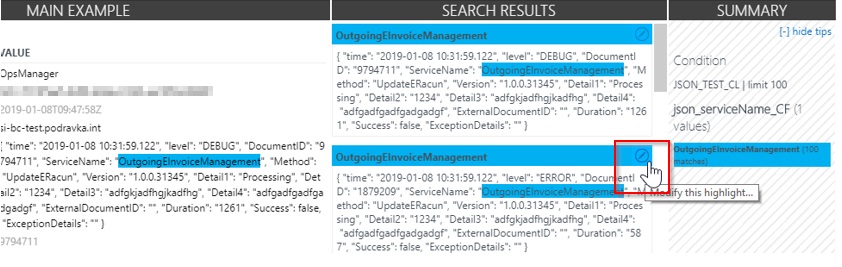
Now a sample query is run and you can fine-tune the search results by changing the highlight or even ignore a sample result by clicking on the pen icon below.
When you are satisfied with the results, click on Save Extraction. Now your custom field is created and you need to wait for a few minutes for next logs to parse. Please note that the extraction is not applied to the logs already stored in Azure Log.
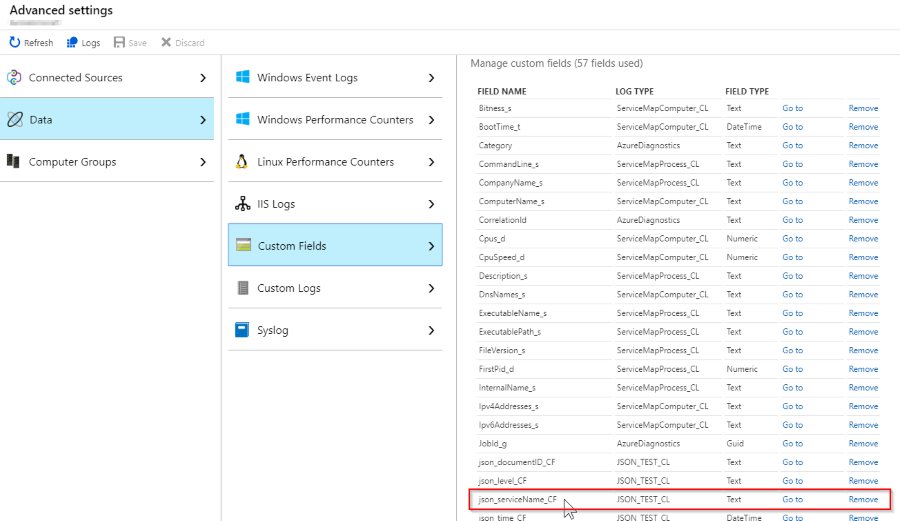
To manage custom fields go to Log Analytics Workspace > Advanced Settings > Data > Custom Fields:
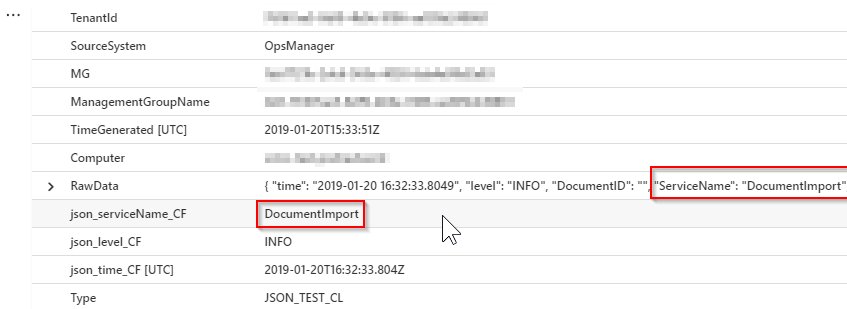
Now, let’s see the sample query of our custom log. You can clearly see that json_serviceName_CF is shown as a column, which was extracted from the RawData column. And that’s it :).
Read more on the subject at Technet blog post.
Thank you for reading and please leave a comment down below :).
Leave a Reply
You must belogged in to post a comment.