


Welcome back. In this post I will continue the discussion about the Azure Log Service, which builds on-top of Shipping logs to Azure and pre-parsing logs. You are welcome to read them first.
Now I will write about adding a custom performance counter monitor to Microsoft monitoring agent on Windows Server machine. But first a bit of background.
Our customer has few Windows virtual machines with web servers and databases, which runs a business critical document system. Those VMs are connected to Azure logs service with Microsoft monitoring agent. By default, “Windows Performance Counters” section inside OMS workspace is already sending some basic performance counters like LogicalDisk(*)\% Free Space, Memory(*)\Available MBytes or Processor(_Total)\% Processor Time every 10 seconds. That’s great to monitor the VM as a whole, but to detect anomalies in business critical processes and applications, we need to be more specific with performance counters to send alerts. In essence, we would like to know when a specific process is giving us a problem.
To add any performance counter to our monitoring agent, we first need to know how to find the counter and what is the correct syntax. Powershell to the rescueeeeee… Let’s open Powershell and type the following:
Get-Counter -Counter “\Memory\Available MBytes”
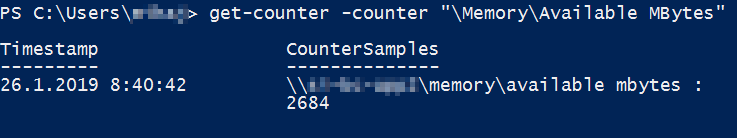
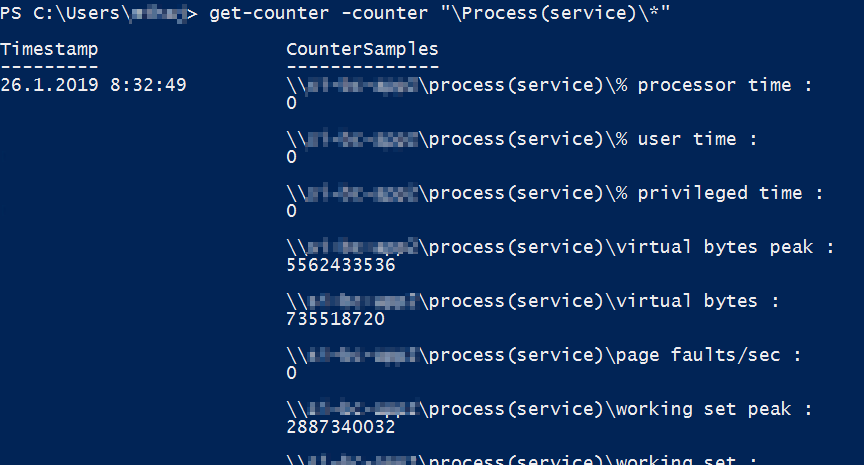
We are calling Get-Counter command to retrieve the available memory on a running machine. Nice! Now I would like to get the available counters of a process on our server. We run the Windows service which has a name Service. Let’s write this command:
Get-Counter -Counter “\Process(service)\*”
Now let’s get more specific and grab Working set – private counter from the service.exe process. We modify the command like this:
Get-Counter -Counter “\Process(service)\Working Set – Private”
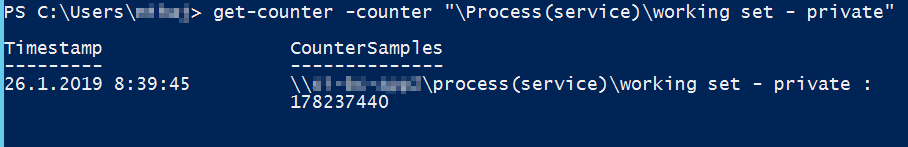
Figure 3: Get working set counter from service.exe process.
What we get back are the bytes of a Working set – private counter.
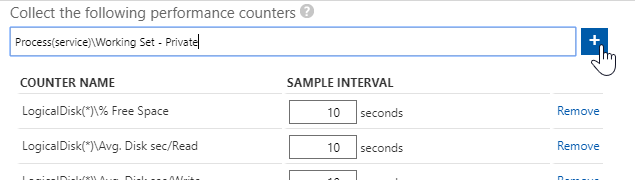
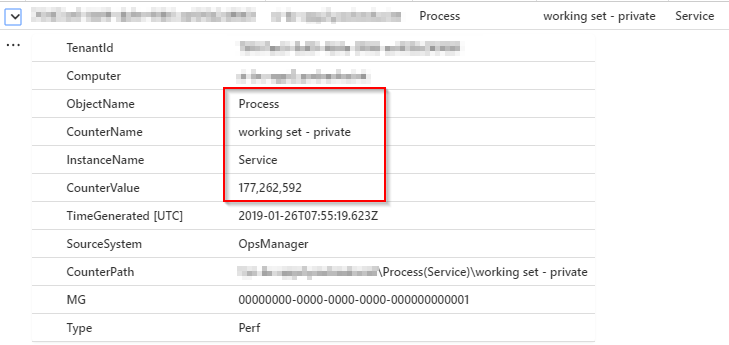
To add this counter to our Azure Log Service, we need to go to Azure portal and set it up. Go to your OMS instance and select Advanced Settings > Data >Windows performance counters from the menu. Now we can add a new counter. In our case we enter the command from above: Process(service)\Working Set – Private, hit add and set the sample interval to 10 seconds or whatever you like.
Within a few minutes we can see the performance counter in Azure logs.
And that’s it! Next time we will setup an Alert so stay tunned :).
If you want to know more about the Get-Counter tool, click here.
Leave a Reply
You must belogged in to post a comment.