


Recently I was involved in a small project, where we needed to improve the monitoring of the business critical 3rd party Web services. Those are installed on-prem.
Web services are developed and maintained by another company, but as with most of our projects, we tried to solve the problem by existing services in Azure. “Luckily” the web services are storing warnings and errors to a file, but to search then and apply monitoring on them is a different story. Since we are already using Azure Log Analytics service, we decided to ship the logs there.
You might ask, what about the log format? Our logs are in JSON format, which I will write about in a future post.
To ship logs to Azure, you need a few things first. I assume you already have an Azure subscription :).
- Azure subscription obviously,
- Azure Operations logs service with a workspace,
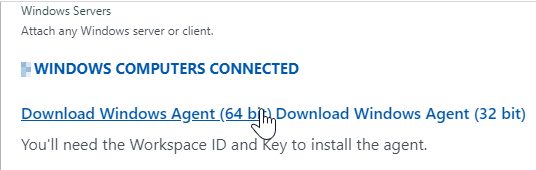
- installed Microsoft Monitoring Agent on a server (figure 1),
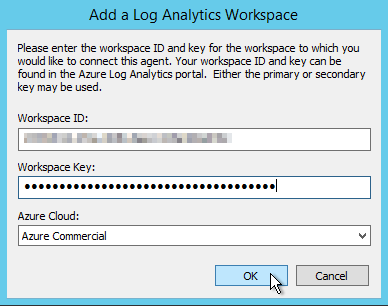
- connected agent with OMS workspace (figure 2),
- sample log file (needed for creating custom).
Now its time we ship some logs! Go to Advanced Setting in your OMS workspace and select Data > Custom Logs section below.
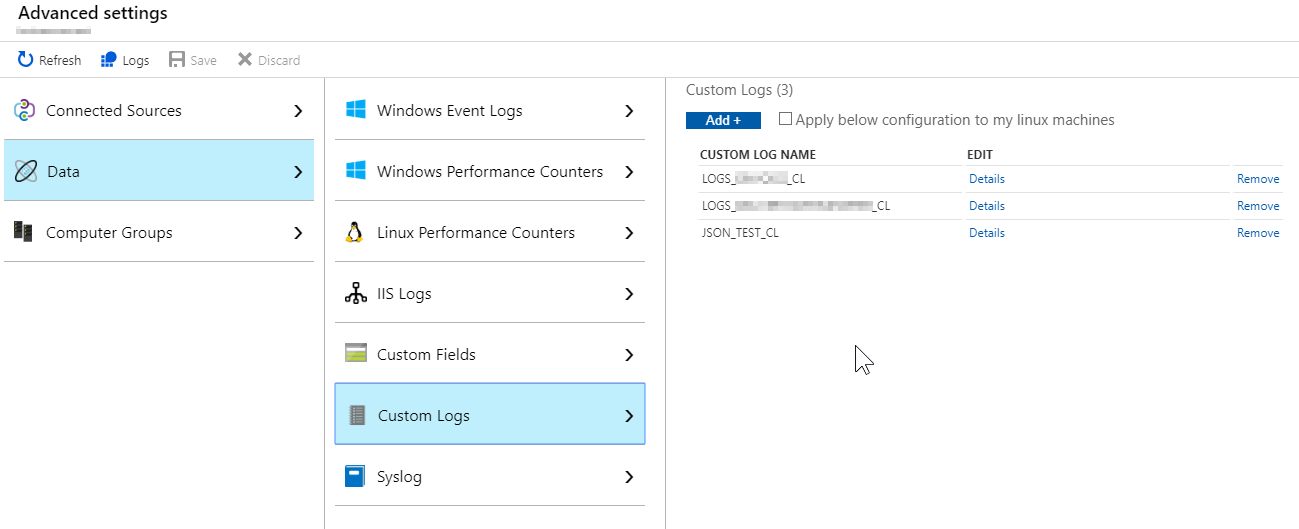
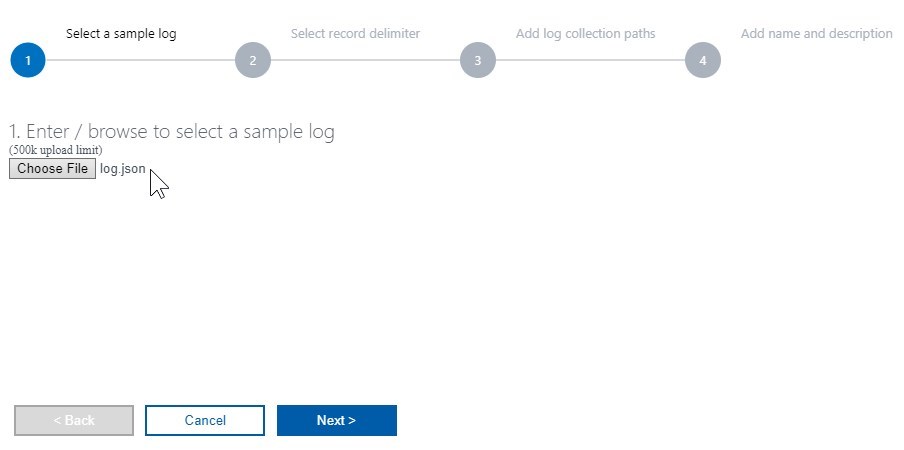
Click on Add + button and add a path to logs on the server, where you have the agent installed. A 4-step wizard is shown where you:
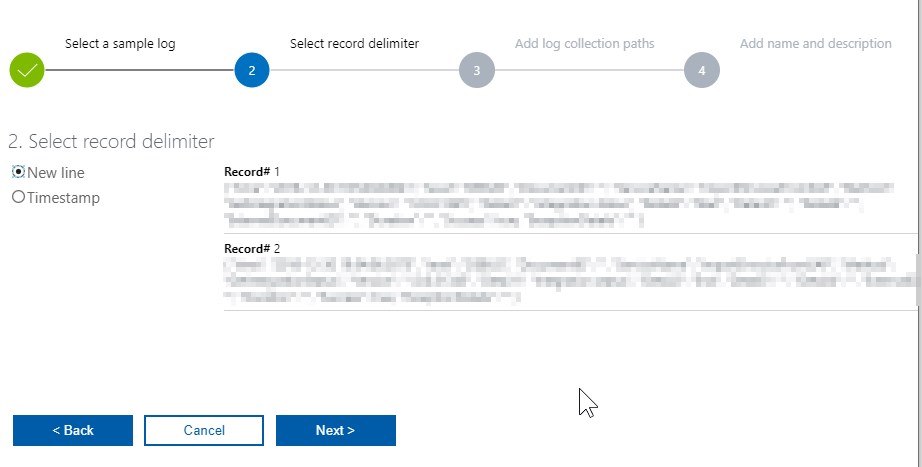
- Select a sample log file,
- select a record delimiter,
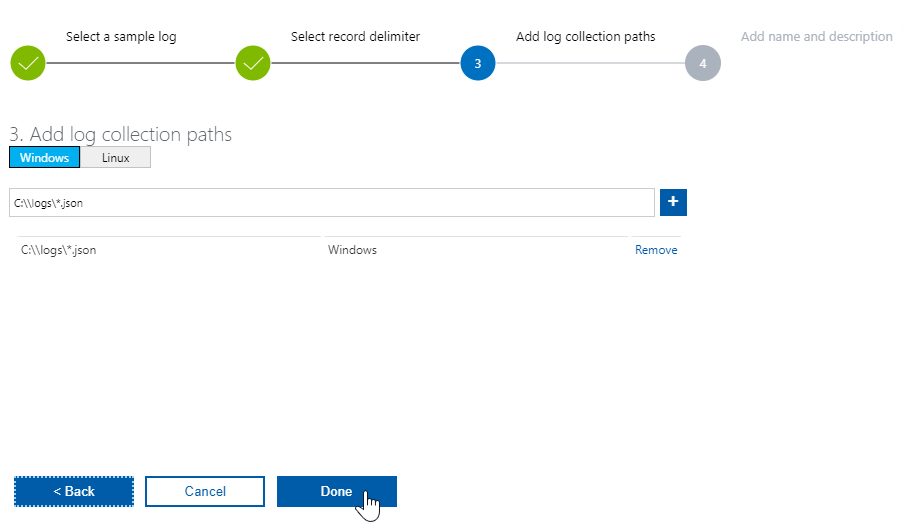
- add a path to the folder on server where the logs are being stored,
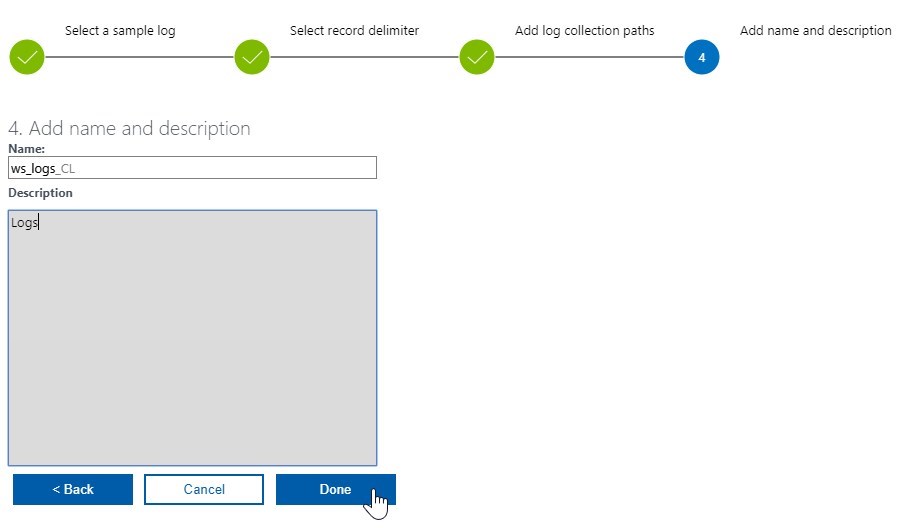
- complete by setting a custom log name.
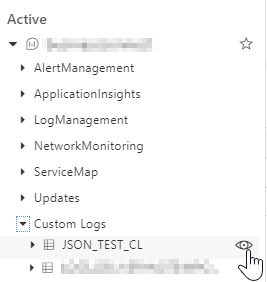
And that’s it! Wait at least 10 minutes for logs to show inside Log Analytics query explorer. Click on the “eye” icon on the custom log you just created and start the query with top 50 results (wait a few more minutes if no results are returned and re-run the query).
You can see that the logs contain a lot of meta-data, the part that is the most interesting to you is “hidden” in RawData column. That is your log record from a log file. To extract a specific part of that column you would have to call parse_json or similar to extract the data as columns. This is not very practical, so I will show you a better way of pre-processing logs as they are imported to the Azure Log Service.
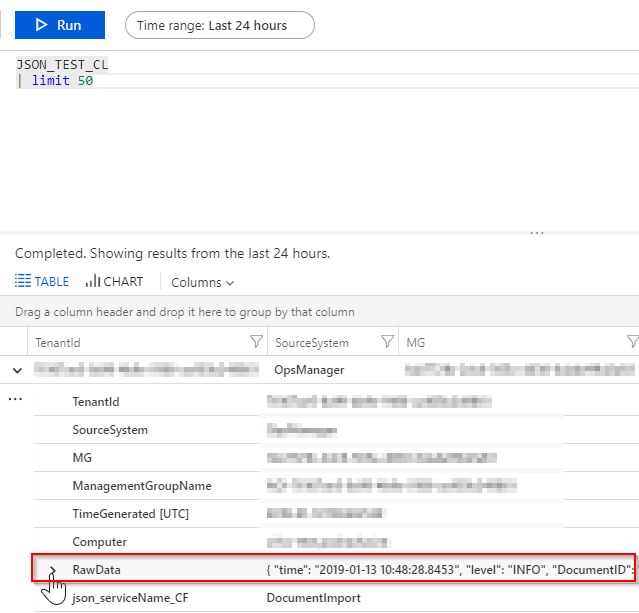
Figure 9: Record sample with RowData column.
Thank you for reading and please leave a comment down below :).
Leave a Reply
You must belogged in to post a comment.