


I like the idea of NDepend. It’s a Swiss army knife for .NET developers, they say on the website, and I would agree with that. It contains many useful code analyzers, metrics, graphs, its own query language, and more.
In fact, it has so many tools that you need to take some time to get familiar with the product. In this post, I’ll give you a taste of only a toothpick (Swiss army knife, remember), and that is a query language it provides. Guys at NDepend created a rich API you can use to discover and “measure” your code in detail. You can also export the code to the dependency graph, HTML, EXCEL, XML, and other file formats.
Now let’s focus on the problem I wanted to solve. A customer has a large codebase, around 100 projects inside one .NET solution. You can easily import your solution to the NDepend (which can filter out the test projects) and get a nice Dashboard with basic metrics. Well, not so basic, there you get the information about the size of your codebase, number of assemblies, types, methods, fields, etc. You can spot on a dashboard the Debt section with quality gates, rules, and issues. In other words, you can quickly see how good is your code quality.
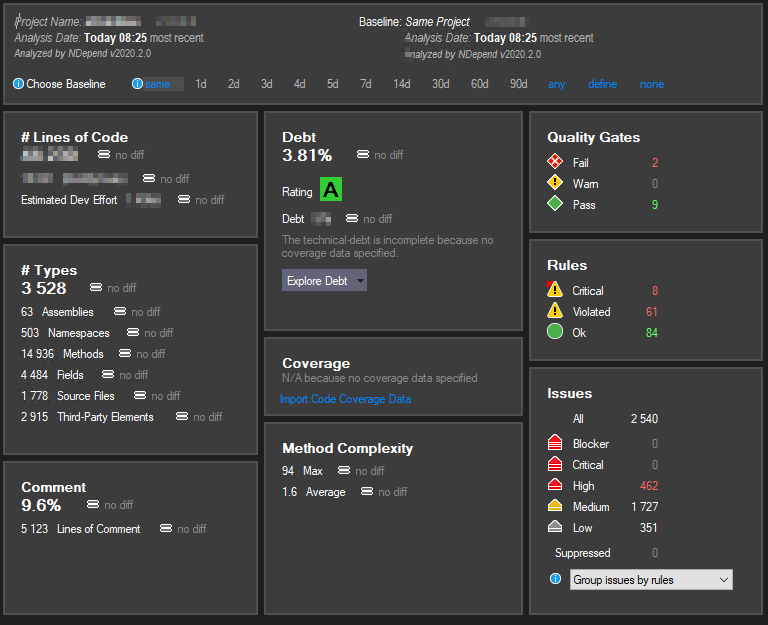
This looks pretty OK with default NDepend settings and without any custom rules specified.
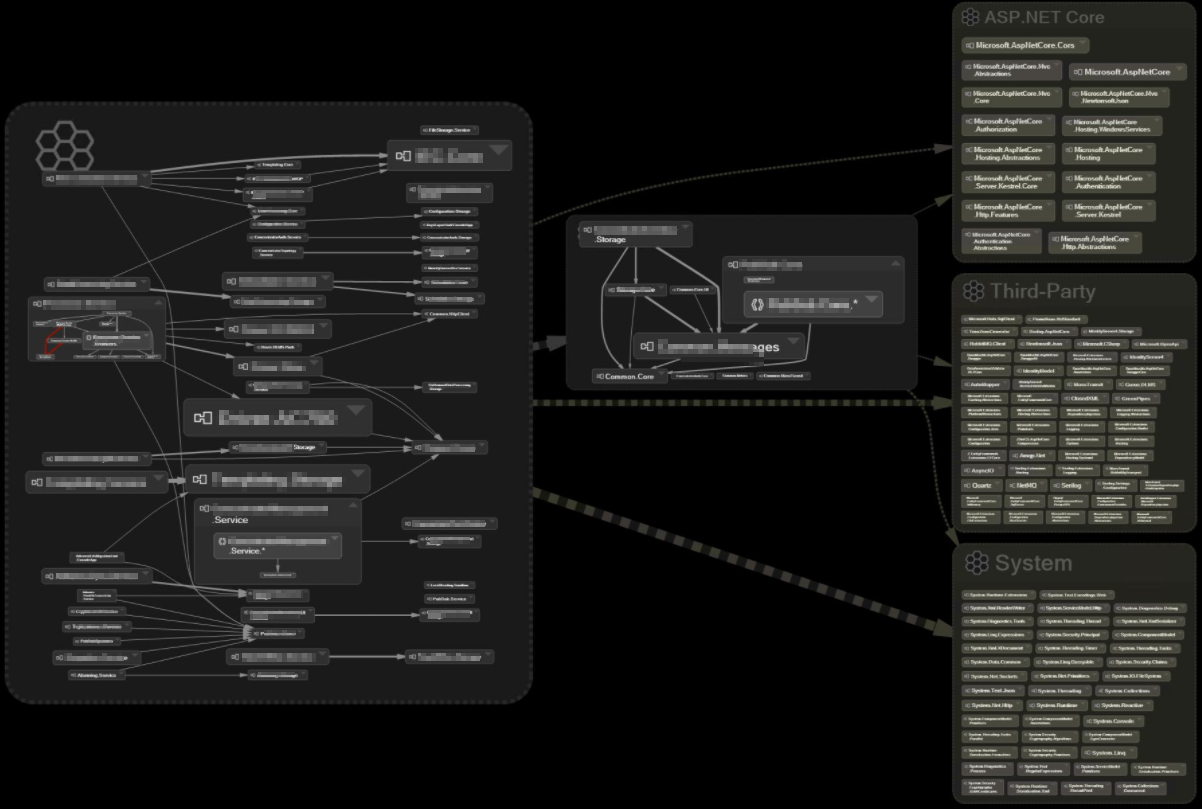
Suppose you go to a dependency graph to see connections between your types, modules, components, and assemblies. I must say that the NDepend team did an excellent job of making things visible, by colors and shapes. You can also zoom in and zoom out, which is very useful in our big project. And navigation on the graph is swift!
To continue our code’s research, I selected an assembly of interest and then right-clicked to select Generate a graph of callers, callees, and children of this assembly. This automatically generates a query we can modify to suit our needs.
|
1 2 3 4 5 6 7 8 9 10 11 |
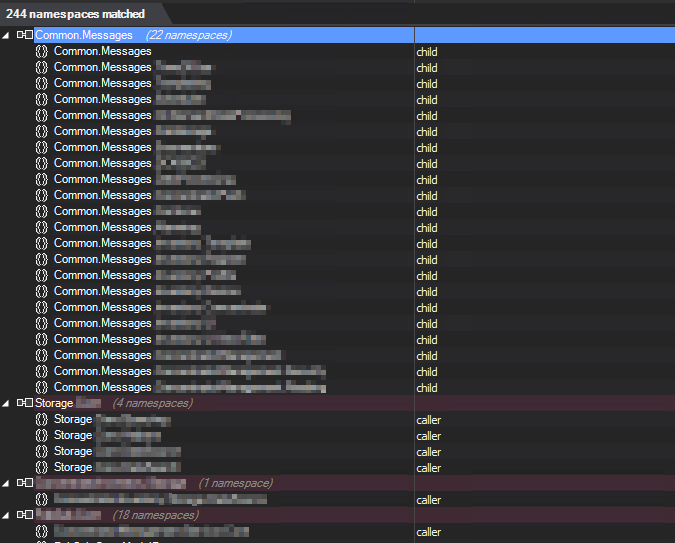
// <Name>Namespaces children, callers and callees of the assembly Common.Messages</Name> let assemblies = Assemblies.WithNameIn( "Common.Messages" ) let children = assemblies.ChildNamespaces().Select(n => new { elem = n,kind = "child" }) let callers = Application.Namespaces.UsingAny(assemblies).Select(n => new { elem = n,kind = "caller" }) let callees = Namespaces.UsedByAny(assemblies).Select(n => new { elem = n,kind = "callee" }) from n in children.Concat(callers).Concat(callees).Distinct(pair => pair.elem) select n |
The query above is a mix of .NET APIs and NDepend custom API, for example, Namespaces.UsedByAny.
The query produces the results that are shown in the Visual Studio:
Now I changed the query a bit to give me more details. The projection at the end defines columns that we want in the report (MessageFullName, UsedByFullName, UsedByAssembly, and UsedByIsClass).
|
1 2 3 4 5 6 7 8 9 10 11 12 13 14 |
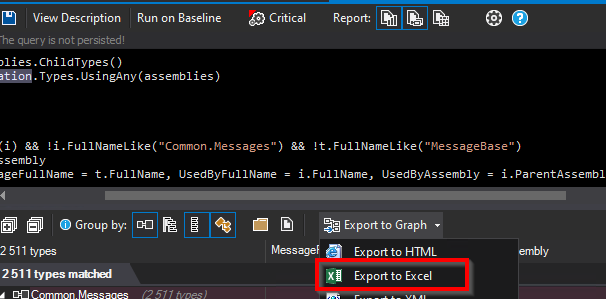
// <Name>Types children, callers and callees of the assembly Common.Messages</Name> let assemblies = Assemblies.WithNameIn( "Common.Messages" ) let children = assemblies.ChildTypes() let callers = Application.Types.UsingAny(assemblies) from t in children from i in callers where t.IsUsedByType(i) && !i.FullNameLike("Common.Messages") && !t.FullNameLike("MessageBase") orderby t, i.ParentAssembly select new { t, MessageFullName = t.FullName, UsedByFullName = i.FullName, UsedByAssembly = i.ParentAssembly, UsedByIsClass = i.IsClass} |
And now, instead of looking at the Visual Studio tree, I want to export the query results to an Excel file. I can do this simply by clicking on the drop-down menu below the query code builder.
Excel file is handy when preparing reports for the developers and team leads. With this, you can copy and paste data to a different spreadsheet and do other Excel magic.
Conclusion
To wrap things up, I would encourage you to apply for the NDepend Trial and see if you can benefit from this tool. I can assure you that when you want to explore and get the overall source code quality, there is rarely a better tool to get the job done.
Pros
- Get your codebase quality, security, and metrics insights. Set a plan on how to get rid of the technical debt,
- analyze your dependencies and spot problems with ease,
- CI/CD pipeline integration for automatic analysis when you develop new features,
- generate reports for your management,
- a lot of online material and videos + great support form the team and Patrick Smacchia,
- and much, much more.
Cons
- It’s a big and quite complex tool, but you need to invest some time to familiarize yourself with it, as with all other big tools.
Leave a Reply
You must belogged in to post a comment.